
TIME TO BUY THE DIP FOR BWXT?
Posted by Chuck Hughes | Feb 1, 2024 | Chuck’s Trade of the Day
On Jan 31st, we looked at a Daily Price Chart of Check Point Software Technologies, Ltd., noting that CHKP has been making a series of new 52-Week Highs recently.
For today’s Trade of the Day we will be looking at a Keltner Channel chart for BWX Technologies, Inc. stock symbol: BWXT.
Before breaking down BWXT’s daily Keltner Channel chart let’s first review which products and services are offered by the company.
BWX Technologies, Inc. supplies precision manufactured components and services to the commercial nuclear power industry. The company offers technical, management and site services to governments in complex facilities and environmental remediation activities.
Unlock Chuck’s trading insights with our free text alerts! Join now for expert tips, live event notifications, and exclusive discounts.
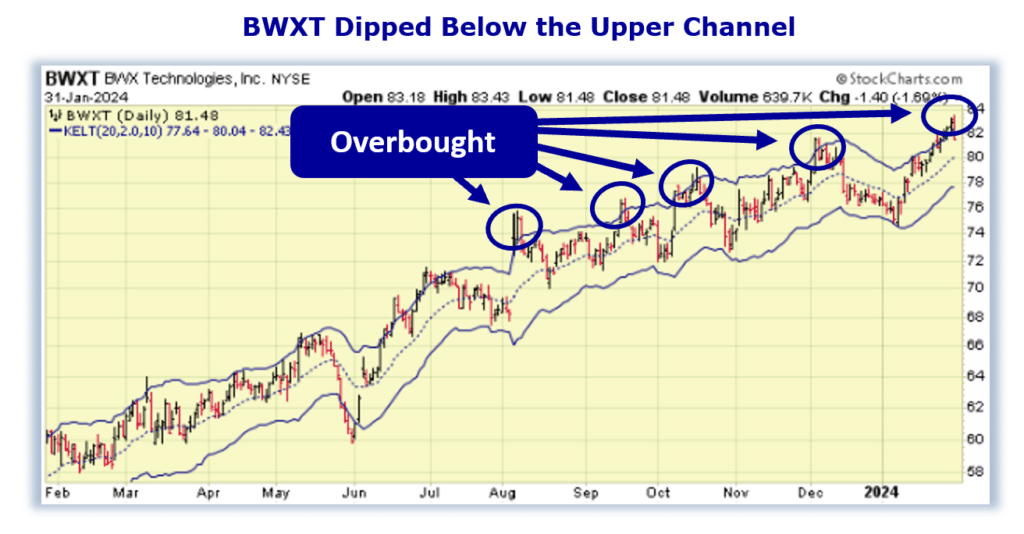
Now, let’s begin to break down the Keltner Channel chart for BWXT. Below is a Daily Price Chart and the three Keltner Channels for BWXT stock.
Buy BWXT Stock
The Hughes Optioneering Team uses the Keltner Channels as an indicator to determine whether a stock is overbought or oversold. If a stock’s daily stock price is trading above the upper Keltner Channel, this signals that the stock is temporarily overbought and subject to a retracement.
Even stocks that are in the strongest bull trends do not advance in a straight line. There are always price retracements along the way. When a stock becomes overbought, its price will typically decline soon after as the inevitable profit taking occurs.
The BWXT daily price chart shows that the stock is in a strong price uptrend and has become overbought several times. You can see this as BWXT has traded above the Upper Keltner Channel on multiple occasions recently.
But, in every scenario when BWXT became overbought, the stock soon experienced a pullback.
Finding opportunities when a stock experiences a pullback is why the Hughes Optioneering Team uses the Keltner Channels. They help us find a lower-risk entry point.
The Keltner Channel “Buy Zone” occurs when a stock is trading below the upper Keltner Channel. Once the daily price is trading below the upper channel, it provides a lower-risk buying opportunity as the stock is likely to rally.
Our initial price target for BWXT stock is 86.50 per share.
Profit if BWXT is Up, Down or Flat
Now, since BWXT is currently trading in the Keltner Channel ‘Buy Zone’ this offers a prime trade entry opportunity. Let’s use the Hughes Optioneering calculator to look at the potential returns for a BWXT call option spread.
The Call Option Spread Calculator will calculate the profit/loss potential for a call option spread based on the price change of the underlying stock/ETF at option expiration in this example from a 7.5% increase to a 7.5% decrease in BWXT stock at option expiration.
The goal of this example is to demonstrate the ‘built in’ profit potential for option spreads and the ability of spreads to profit if the underlying stock is up, down or flat at option expiration. Out of fairness to our paid option service subscribers we don’t list the option strike prices used in the profit/loss calculation.
The prices and returns represented below were calculated based on the current stock and option pricing for BWXT on 1/31/2024 before commissions.
Built in Profit Potential
For this option spread, the calculator analysis below reveals the cost of the spread is $330 (circled). The maximum risk for an option spread is the cost of the spread.
The analysis reveals that if BWXT stock is flat or up at all at expiration the spread will realize a 51.5% return (circled).
And if BWXT stock decreases 7.5% at option expiration, the option spread would make a 51.5% return (circled).
Due to option pricing characteristics, this option spread has a ‘built in’ 51.5% profit potential when the trade was identified*.

Managing Trade Cost
One of the big advantages to trading option spreads is that spreads allow you to trade high price stocks like Amazon, Google, or Netflix for as little as $350. With an option spread you can control 100 shares of Netflix for $350.
If you were to purchase 100 shares of Netflix at current prices it would cost about $56,000. With the stock purchase you are risking $56,000 but with a Netflix option spread that costs $350 your maximum risk is $350 so your dollar risk is lower with option spreads compared to stock purchases.