
ARES: TECHNICAL BUY SIGNAL SPOTTED
Posted by Chuck Hughes | Dec 11, 2023 | Chuck’s Trade of the Day
On December 11th,, we looked at a Monthly Price Chart for Uber Technologies, Inc., noting that UBER’s 1-Month Price is trading above the 10-Month SMA signaling a ‘Buy’.
For today’s Trade of the Day e-letter we will be looking at a daily price chart for Ares Management Corporation stock symbol: ARES.
Before breaking down ARES’s daily chart let’s first review what products and services the company offers.
Ares Management Corporation operates as an alternative asset manager in the United States, Europe, and Asia. The company’s Tradable Credit Group segment manages various types of investment funds, such as commingled and separately managed accounts for institutional investors, and publicly traded vehicles and sub-advised funds for retail investors in the tradable and non-investment grade corporate credit markets.
Now, let’s begin to break down the Daily Price chart for ARES stock.
Below is a Daily Price chart with the 50-Day EMA and 100-Day EMA for ARES.
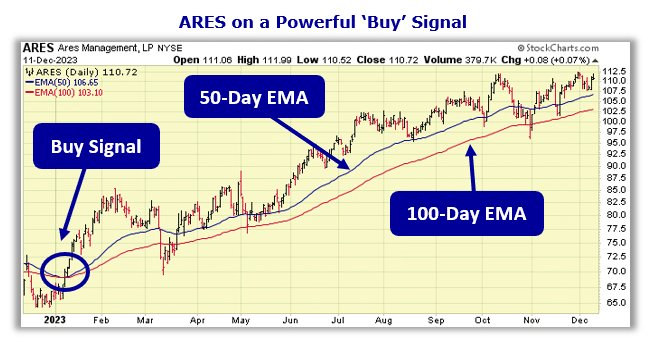
50-Day EMA and 100-Day EMA ‘Buy’ Signal
The 50-Day Exponential Moving Average (EMA) and 100-Day EMA are moving average indicator lines that can provide buy and sell signals when used together. When the shorter-term 50-Day EMA crosses above or below the longer-term 100-Day EMA, this provides either a buy or sell signal depending on which direction the stock price is moving.
- 50-Day EMA line Above 100-Day EMA = Price Uptrend = Buy signal
- 50 Day EMA line Below 100-Day EMA = Price Downtrend = Sell signal
When the 50-Day EMA (blue line) crosses above the 100-Day EMA (red line) this indicates that the stock’s buying pressure has begun to outweigh the selling pressure signaling a ‘buy’ signal. When the 50-Day EMA crosses below the 100-Day EMA this indicates that the selling pressure has begun to outweigh the buying pressure signaling a ‘sell’ signal.
Buy ARES Stock
As the chart shows, on January 9th, the ARES 50-Day EMA, crossed above the 100-Day EMA.
This crossover indicated the buying pressure for ARES stock exceeded the selling pressure. For this kind of crossover to occur, a stock has to be in a strong bullish trend.
Now, as you can see, the 50-Day EMA is still above the 100-Day EMA meaning the ‘buy’ signal is still in play.
As long as the 50-Day EMA remains above the 100-Day EMA, the stock is more likely to keep trading at new highs and should be purchased.
Our initial price target for ARES stock is 120.00 per share.
90.3% Profit Potential for ARES Option
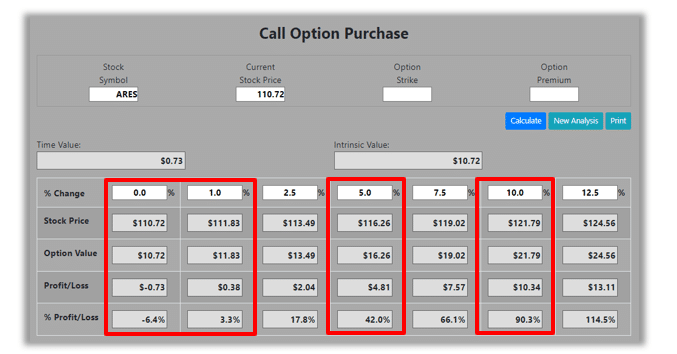
Now, since ARES’s 50-Day EMA is trading above the 100-Day EMA this means the stock’s bullish rally will likely continue. Let’s use the Hughes Optioneering calculator to look at the potential returns for an ARES call option purchase.
The Call Option Calculator will calculate the profit/loss potential for a call option trade based on the price change of the underlying stock/ETF at option expiration in this example from a flat ARES price to a 12.5% increase.
The Optioneering Team uses the 1% Rule to select an option strike price with a higher percentage of winning trades. In the following ARES option example, we used the 1% Rule to select the ARES option strike price but out of fairness to our paid option service subscribers we don’t list the strike price used in the profit/loss calculation.
Trade with Higher Accuracy
When you use the 1% Rule to select a ARES in-the-money option strike price, ARES stock only has to increase 1% for the option to breakeven and start profiting! Remember, if you purchase an at-the-money or out-of-the-money call option and the underlying stock closes flat at option expiration it will result in a 100% loss for your option trade! In this example, if ARES stock is flat at 110.72 at option expiration, it will only result in a 6.4% loss for the ARES option compared to a 100% loss for an at-the-money or out-of-the-money call option.
Using the 1% Rule to select an option strike price can result in a higher percentage of winning trades compared to at-the-money or out-of-the-money call options. This higher accuracy can give you the discipline needed to become a successful option trader and can help avoid 100% losses when trading options.
The goal of this example is to demonstrate the powerful profit potential available from trading options compared to stocks.
The prices and returns represented below were calculated based on the current stock and option pricing for ARES on 12/11/2023 before commissions.
When you purchase a call option, there is no limit on the profit potential of the call if the underlying stock continues to move up in price.
For this specific call option, the calculator analysis below reveals if ARES stock increases 5.0% at option expiration to 116.26 (circled), the call option would make 42.0% before commission.
If ARES stock increases 10.0% at option expiration to 121.79 (circled), the call option would make 90.3% before commission and outperform the stock return more than 9 to 1*.
The leverage provided by call options allows you to maximize potential returns on bullish stocks.
The Hughes Optioneering Team is here to help you identify profit opportunities just like this one.
Interested in accessing the Optioneering Calculators? Join one of Chuck’s Trading Services for unlimited access! The Optioneering Team has option calculators for six different option strategies that allow you to calculate the profit potential for an option trade before you take the trade.
*Trading incurs risk and some people lose money trading.