
CAT: The Technicals Suggest a ‘Buy’
Oct. 3rd, 2024
CAT: The Technicals Suggest a ‘Buy’
On October 2nd, we looked at a Daily Price Chart of Builders FirstSource, Inc., noting that BLDR’s 50-Day EMA is trading above the 100-Day EMA signaling a ‘Buy’.
For October 3rd Trade of the Day e-letter we will be looking at a Moving Average Convergence/ Divergence (MACD) chart for Caterpillar, Inc. stock symbol: CAT.
Before breaking down CAT’s MACD chart let’s first review what products and services the company offers.
Caterpillar Inc. is the world’s leading manufacturer of construction and mining equipment, off-highway diesel and natural gas engines, industrial gas turbines and diesel-electric locomotives.
MACD Indicator confirms Price Momentum
The CAT daily price chart below shows that CAT is in a price uptrend as the 24/52 day MACD line (black line) is above the 18-Day EMA (purple line). The Moving Average Convergence/ Divergence chart is shown below the daily price chart.
MACD uses moving averages to create a momentum indicator by subtracting the longer-term moving average from the shorter-term moving average. The MACD is calculated by subtracting a stock’s longer term 52-Day Exponential Moving Average (EMA) from its shorter term 24-Day EMA. This creates the MACD line.
MACD ‘Buy’ Signal
The 18-Day EMA line functions as a buy/sell ‘trigger’. When the 24/52 Day MACD line crosses above the 18-Day EMA line it indicates positive momentum and higher prices for the stock. When the 24/52 Day MACD lines crosses below the 18-Day EMA it indicates negative momentum and lower prices for the stock. MACD is more of a leading indicator than a moving average crossover which tends to lag price movement.
MACD Histogram shows Acceleration of Momentum
Also included in a MACD chart is the histogram bar graph. This portion of the chart helps to illustrate the distance between the 24/52 Day MACD and the 18-Day EMA.
When a crossover initially occurs, the histogram’s bar will be near flat as the two indicator lines have converged. As the lines begin to separate, the bars grow in height, indicating a widening gap and acceleration for the stock’s momentum. When the histogram’s bars begin to shrink this indicates a narrowing of the gap between the 24/52 Day MACD and the 18-Day EMA and a slowing of the stock’s momentum. When the gap between the two indicators begins to narrow, this typically indicates a crossover of the indicator lines could happen soon.
CAT MACD Signaling a ‘Buy’
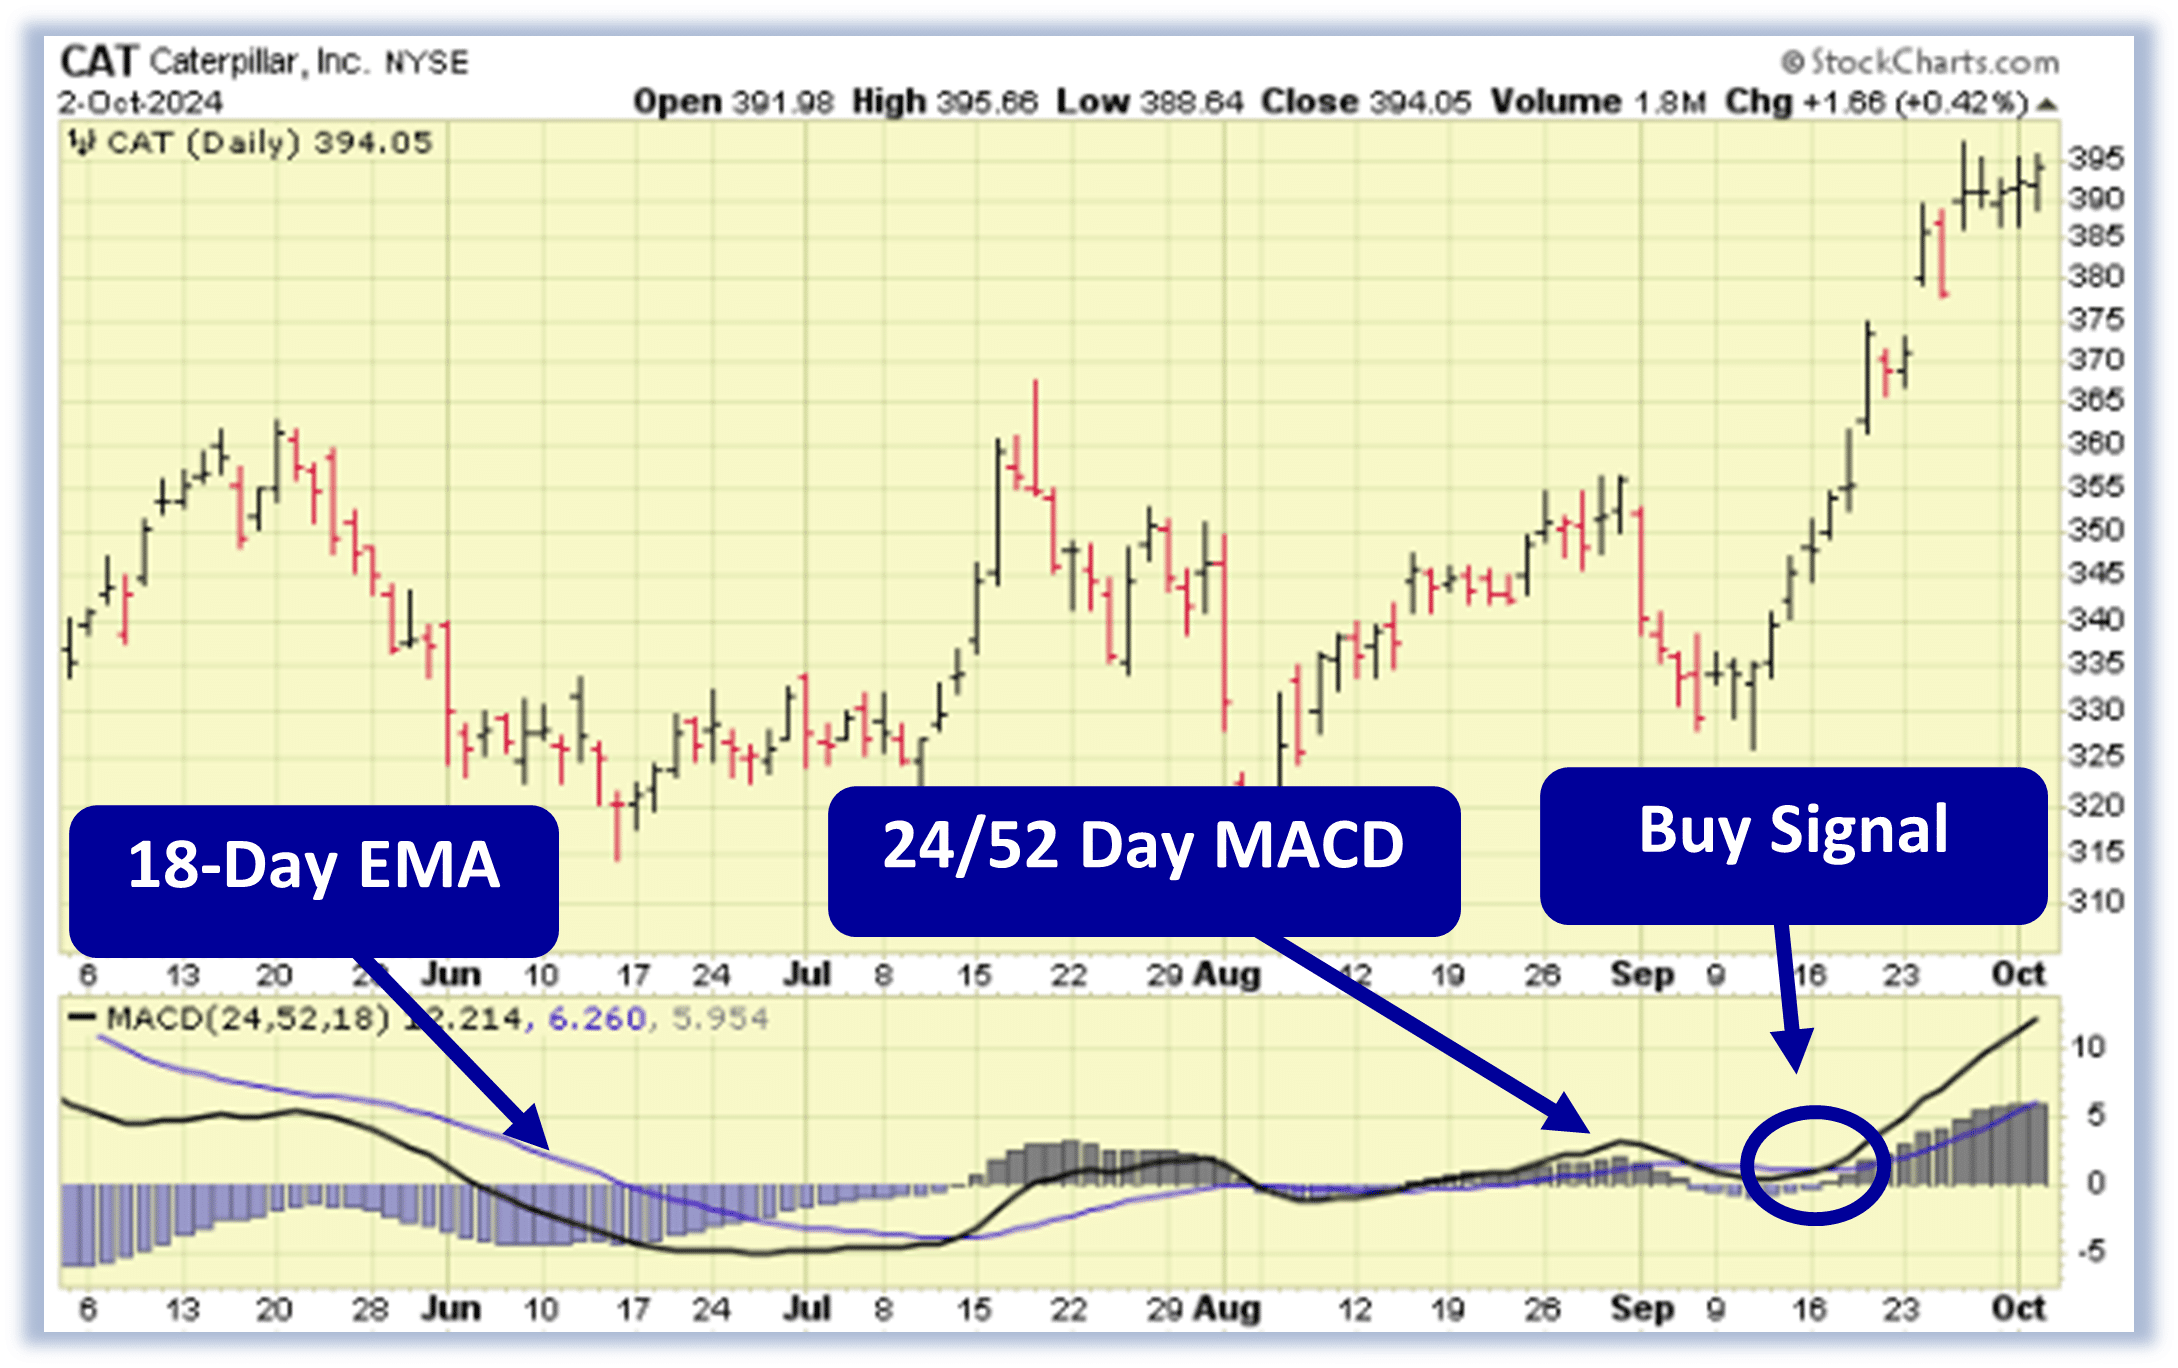
Buy CAT Stock
As long as the 24/52 Day MACD line remains above the 18-Day EMA, the stock is more likely to keep trading at new highs in the coming days and weeks.
Since CAT’s bullish run is likely to continue, the stock should be purchased.
Our initial price target for CAT stock is 407.25 per share.
156.9% Profit Potential for CAT Option
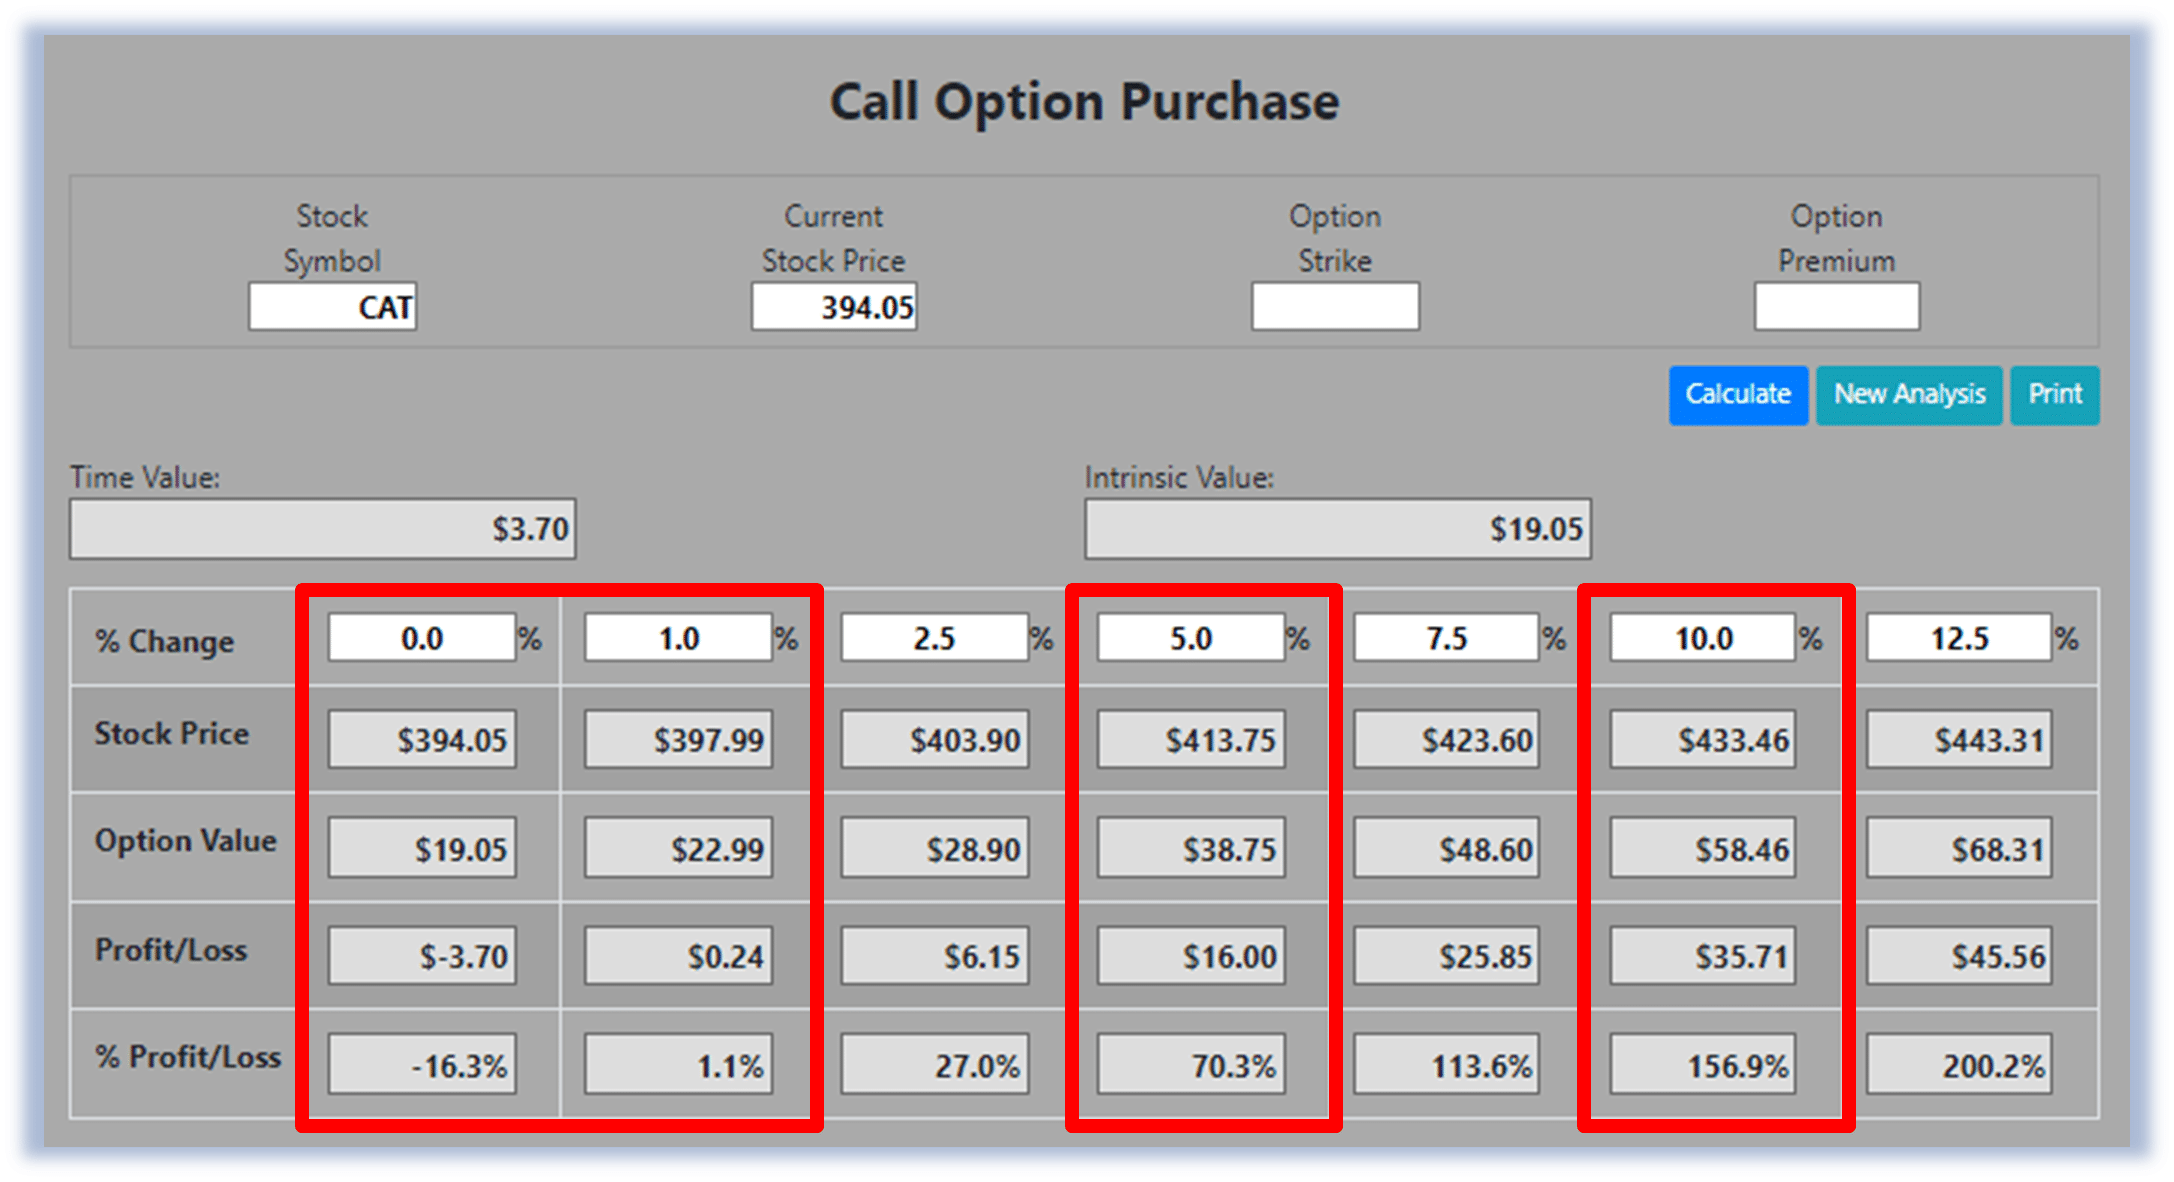
Now, since CAT’s 24/52 Day MACD is trading above the 18-Day EMA this means the stock’s bullish rally will likely continue. Let’s use the Hughes Optioneering calculator to look at the potential returns for a CAT call option purchase.
The Call Option Calculator will calculate the profit/loss potential for a call option trade based on the price change of the underlying stock/ETF at option expiration in this example from a flat CAT price to a 12.5% increase.
The Optioneering Team uses the 1% Rule to select an option strike price with a higher percentage of winning trades. In the following CAT option example, we used the 1% Rule to select the CAT option strike price but out of fairness to our paid option service subscribers we don’t list the strike price used in the profit/loss calculation.
Trade with Higher Accuracy
When you use the 1% Rule to select a CAT in-the-money option strike price, CAT stock only has to increase 1% for the option to breakeven and start profiting! Remember, if you purchase an at-the-money or out-of-the-money call option and the underlying stock closes flat at option expiration it will result in a 100% loss for your option trade! In this example, if CAT stock is flat at 394.05 at option expiration, it will only result in a 16.3% loss for the CAT option compared to a 100% loss for an at-the-money or out-of-the-money call option.
Using the 1% Rule to select an option strike price can result in a higher percentage of winning trades compared to at-the-money or out-of-the-money call options. This higher accuracy can give you the discipline needed to become a successful option trader and can help avoid 100% losses when trading options.
The goal of this example is to demonstrate the powerful profit potential available from trading options compared to stocks.
The prices and returns represented below were calculated based on the current stock and option pricing for CAT on 10/2/2024 before commissions.
When you purchase a call option, there is no limit on the profit potential of the call if the underlying stock continues to move up in price.
For this specific call option, the calculator analysis below reveals if CAT stock increases 5.0% at option expiration to 413.75 (circled), the call option would make 70.3% before commission.
If CAT stock increases 10.0% at option expiration to 433.46 (circled), the call option would make 156.9% before commission and outperform the stock return nearly 16 to 1*.
The leverage provided by call options allows you to maximize potential returns on bullish stocks.
The Hughes Optioneering Team is here to help you identify profit opportunities just like this one.
*Trading incurs risk and some people lose money trading.