
Cummins Shares Powering Ahead!
Oct 9th, 2024
Cummins Shares Powering Ahead!
Following the market’s open this morning, I began the day how I normally do, looking to see if there were any new stocks that looked strong enough to merit being added to my ‘Buy List’.
As I was looking, one stock in particular really stood above the rest. The stock I am talking about is Cummins Inc., symbol: (CMI).
You may be asking yourself, how did you find this stock, Chuck? Well, it was pretty simple really, let me tell you about one truly elementary screening method I consistently use to find stocks as they are breaking out to the upside.
This one method I use to spot stocks in powerful uptrends is checking the daily ‘New 52-Week Highs’ list. If a stock like CMI appears on the New 52-Week Highs list for consecutive days, this series of new highs is a signal that the stock is currently experiencing a breakout higher.
You can see below in the current chart of Cummins Inc. that the stock is displaying exactly the type of bullish breakout that I’m looking for. CMI shares have been making a series of new 52-Week Highs since late-September.

The reason that I look for stocks that have recently made a series of new 52-Week Highs is that generally there is strong conviction from investors which translates to strong buying pressure for the stock. This flood of buying pressure will result in the stock making a move higher.
Oftentimes, once a stock makes a series of new highs, the breakout is not over and done with, in fact, in many cases it’s just getting started. In powerful bull markets, stocks breaking out to the upside can often continue to trade higher for longer than most investors may think.
So, when I spot a stock with a compelling breakout like CMI, this is a stock I want to add to my ‘Buy List’ so that I can keep an eye out for a good trade setup.
How I Would Look to Trade It
Now that we have become aware of CMI’s bullish breakout higher, the next thing we want to search for is an attractive trading setup for the stock.
I want to look to trade CMI’s trend and have the opportunity to capture some profits by placing an options trade on the stock.
Below is a Call Option Debit spread for CMI that I found just this morning that would allow me to gain some exposure to the stock’s powerful bullish trend but also have some downside protection built in as well. Let me tell you how this works.
Once I place a Call Option Debit spread, it has the ability to profit if the underlying stock/ETF is either up, flat, or even down a bit at option expiration.
Below is a snapshot of my Call Option Debit Spread Calculator that shows the profit potential and downside protection analysis for my trade. This example examines a range of a 7.5% increase to a 7.5% decrease in CMI share price at option expiration.
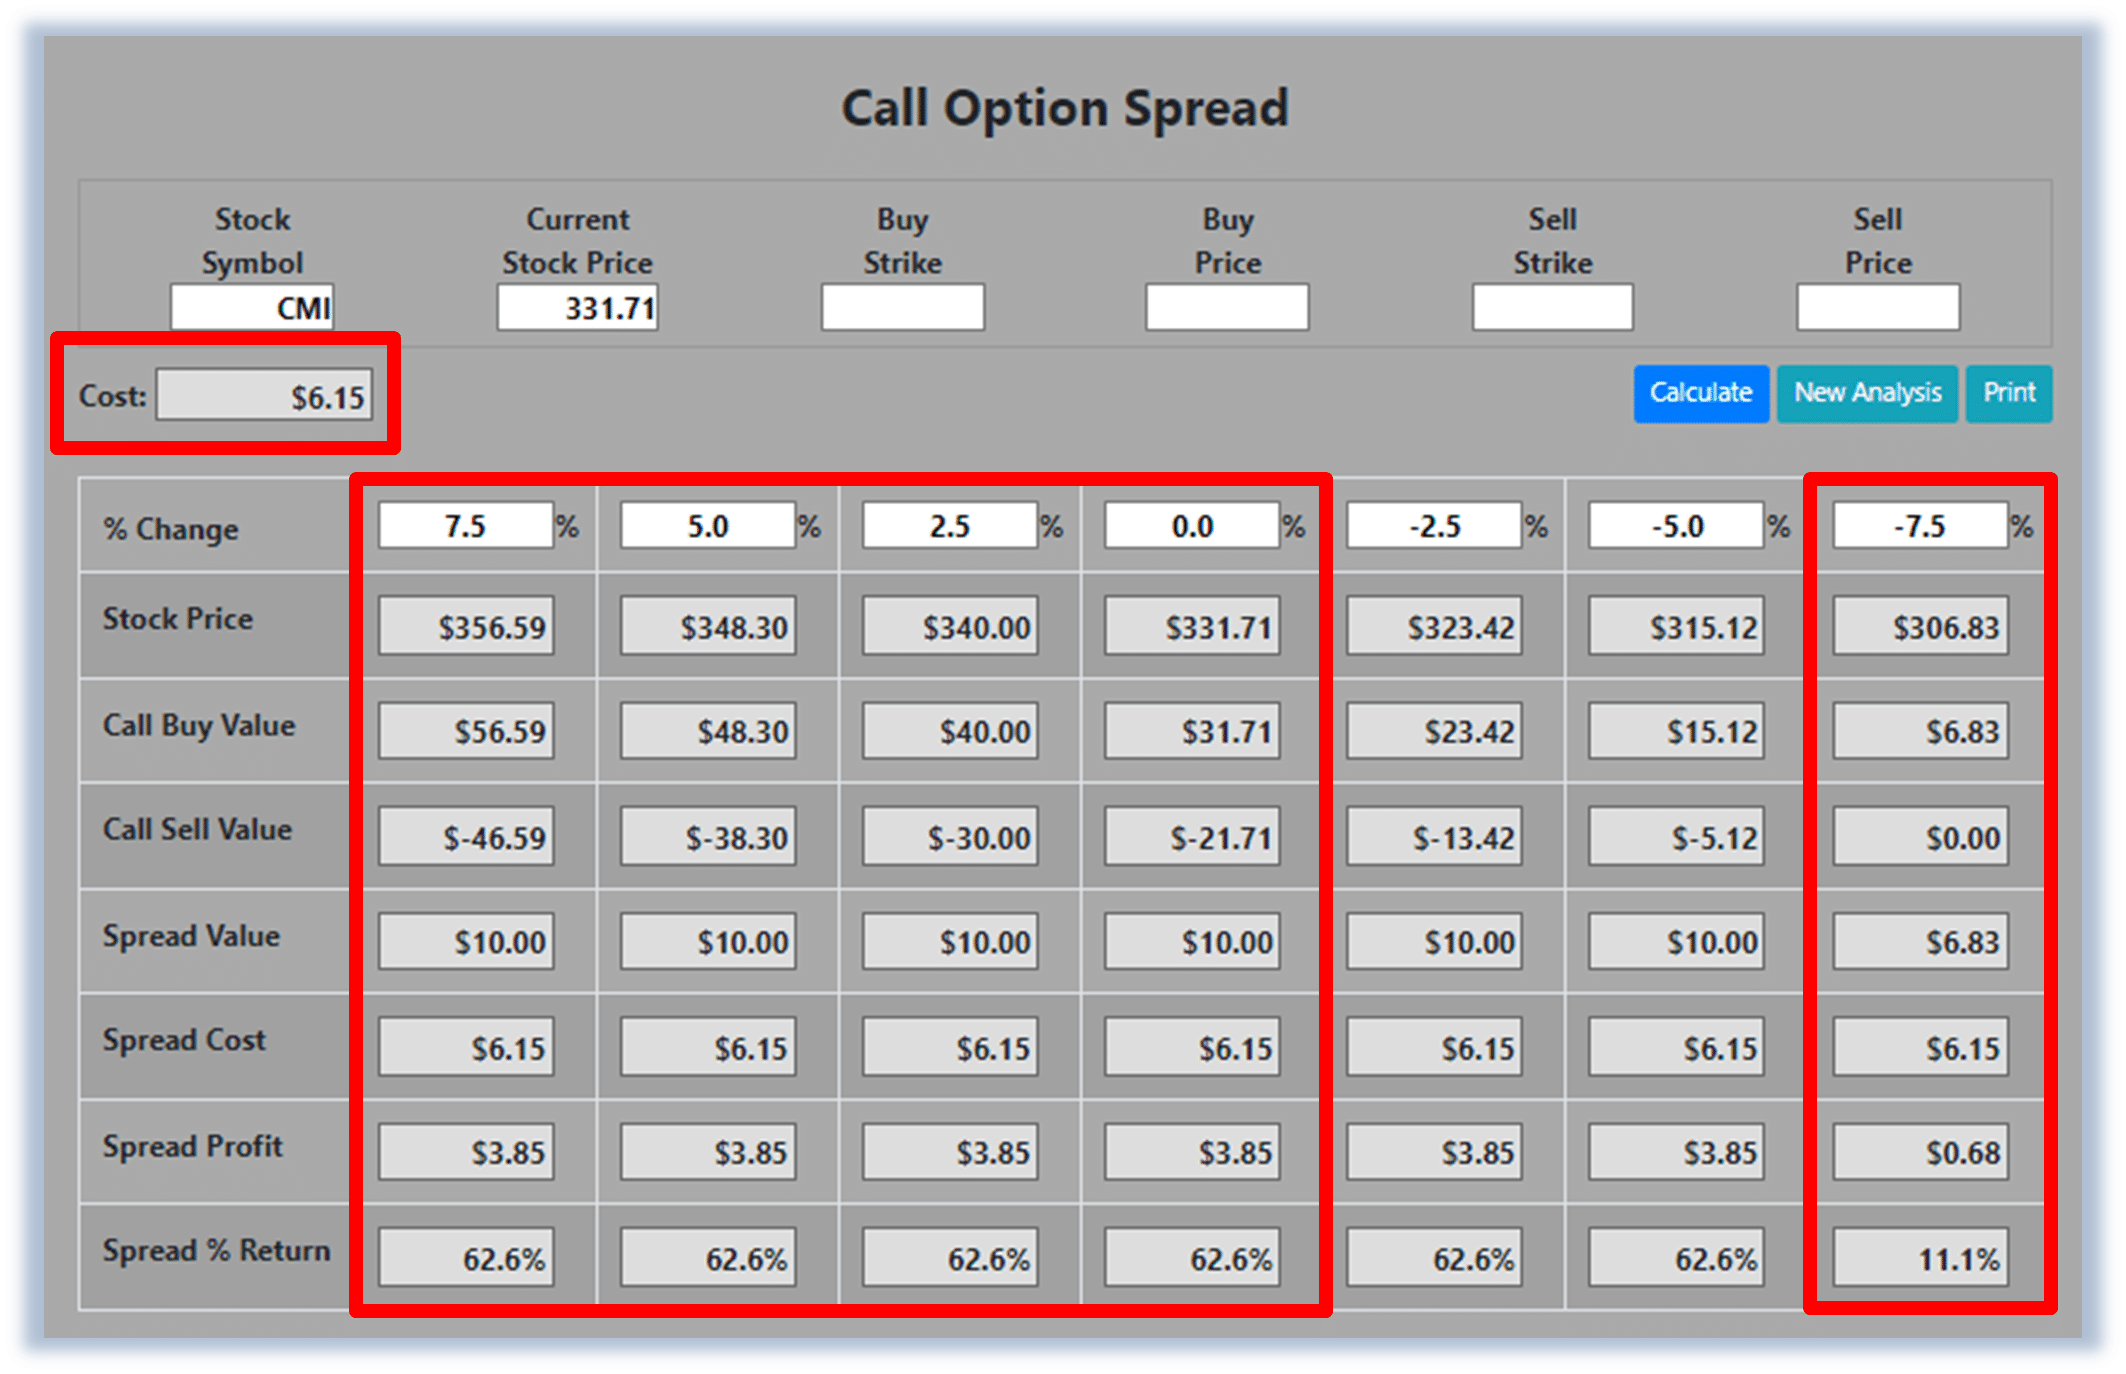
Looking at the trade analysis, the calculator shows that this one single trade, that would cost you only $615 to enter, has the ability to profit 62.6%.
The calculator reveals that if CMI, at option expiration, were to increase, remain flat, or even drop by as much as 5.0%, this low-cost trade would be set up to make a 62.6% return!
This Call Option Debit Spread strategy has been one of my absolute favorites to trade over the years and remains so today. The key behind it all is that by enabling your ability to profit if a stock is up, flat, or even down a bit gives you a much higher probability that your trade will end up a winner.
*Trading incurs risk and some people lose money trading.