
IBKR Enjoys Wave of Buying Pressure
Oct. 10th, 2024
IBKR Enjoys Wave of Buying Pressure
On October 9th, we looked at a Daily Price Chart of Cummins Inc., noting that CMI shares have been making a series of new 52-Week Highs recently.
For yesterday Trade of the Day we will be looking at an On Balance Volume chart for Interactive Brokers Group, Inc. stock symbol: IBKR.
Before breaking down IBKR’s OBV chart let’s first review which products and services are offered by the company.
Interactive Brokers Group Inc. operates as an automated global electronic market maker and broker. The company specializes in routing orders, besides executing and processing trades in securities, futures, foreign exchange instruments, bonds and mutual funds on more than 135 electronic exchanges and market centers worldwide.
Confirming a Price Uptrend with OBV
The IBKR daily price chart below shows that IBKR is in a price uptrend as the current price is above the price IBKR traded at five months ago (circled). The On Balance Volume chart is below the daily chart.
On Balance Volume measures volume flow with a single Easy-to-Read Line. Volume flow precedes price movement and helps sustain the price uptrend. When a stock closes up, volume is added to the line. When a stock closes down, volume is subtracted from the line. A cumulative total of these additions and subtractions form the OBV line.
On Balance Volume Indicator
● When Close is Up, Volume is Added
● When Close is Down, Volume is Subtracted
● A Cumulative Total of Additions and Subtractions form the OBV Line
Volume flow precedes price and is the key to measuring the validity and sustainability of a price trend.
We can see from the OBV chart below that the On Balance Volume line for IBKR is sloping up. An up-sloping line indicates that the volume is heavier on up days and buying pressure is exceeding selling pressure. Buying pressure must continue to exceed selling pressure in order to sustain a price uptrend. So, On Balance Volume is a simple indicator to use that confirms the price uptrend and its sustainability. The numerical value of the On Balance Volume line is not important. We simply want to see an up-sloping line to confirm a price uptrend.

Confirmed ‘Buy’ Signal for IBKR
Since IBKR’s OBV line is sloping up, the most likely future price movement for IBKR is up, making IBKR a good candidate for a stock purchase or a call option purchase.
Let’s use the Hughes Optioneering calculator to look at the potential returns for an IBKR call option purchase.
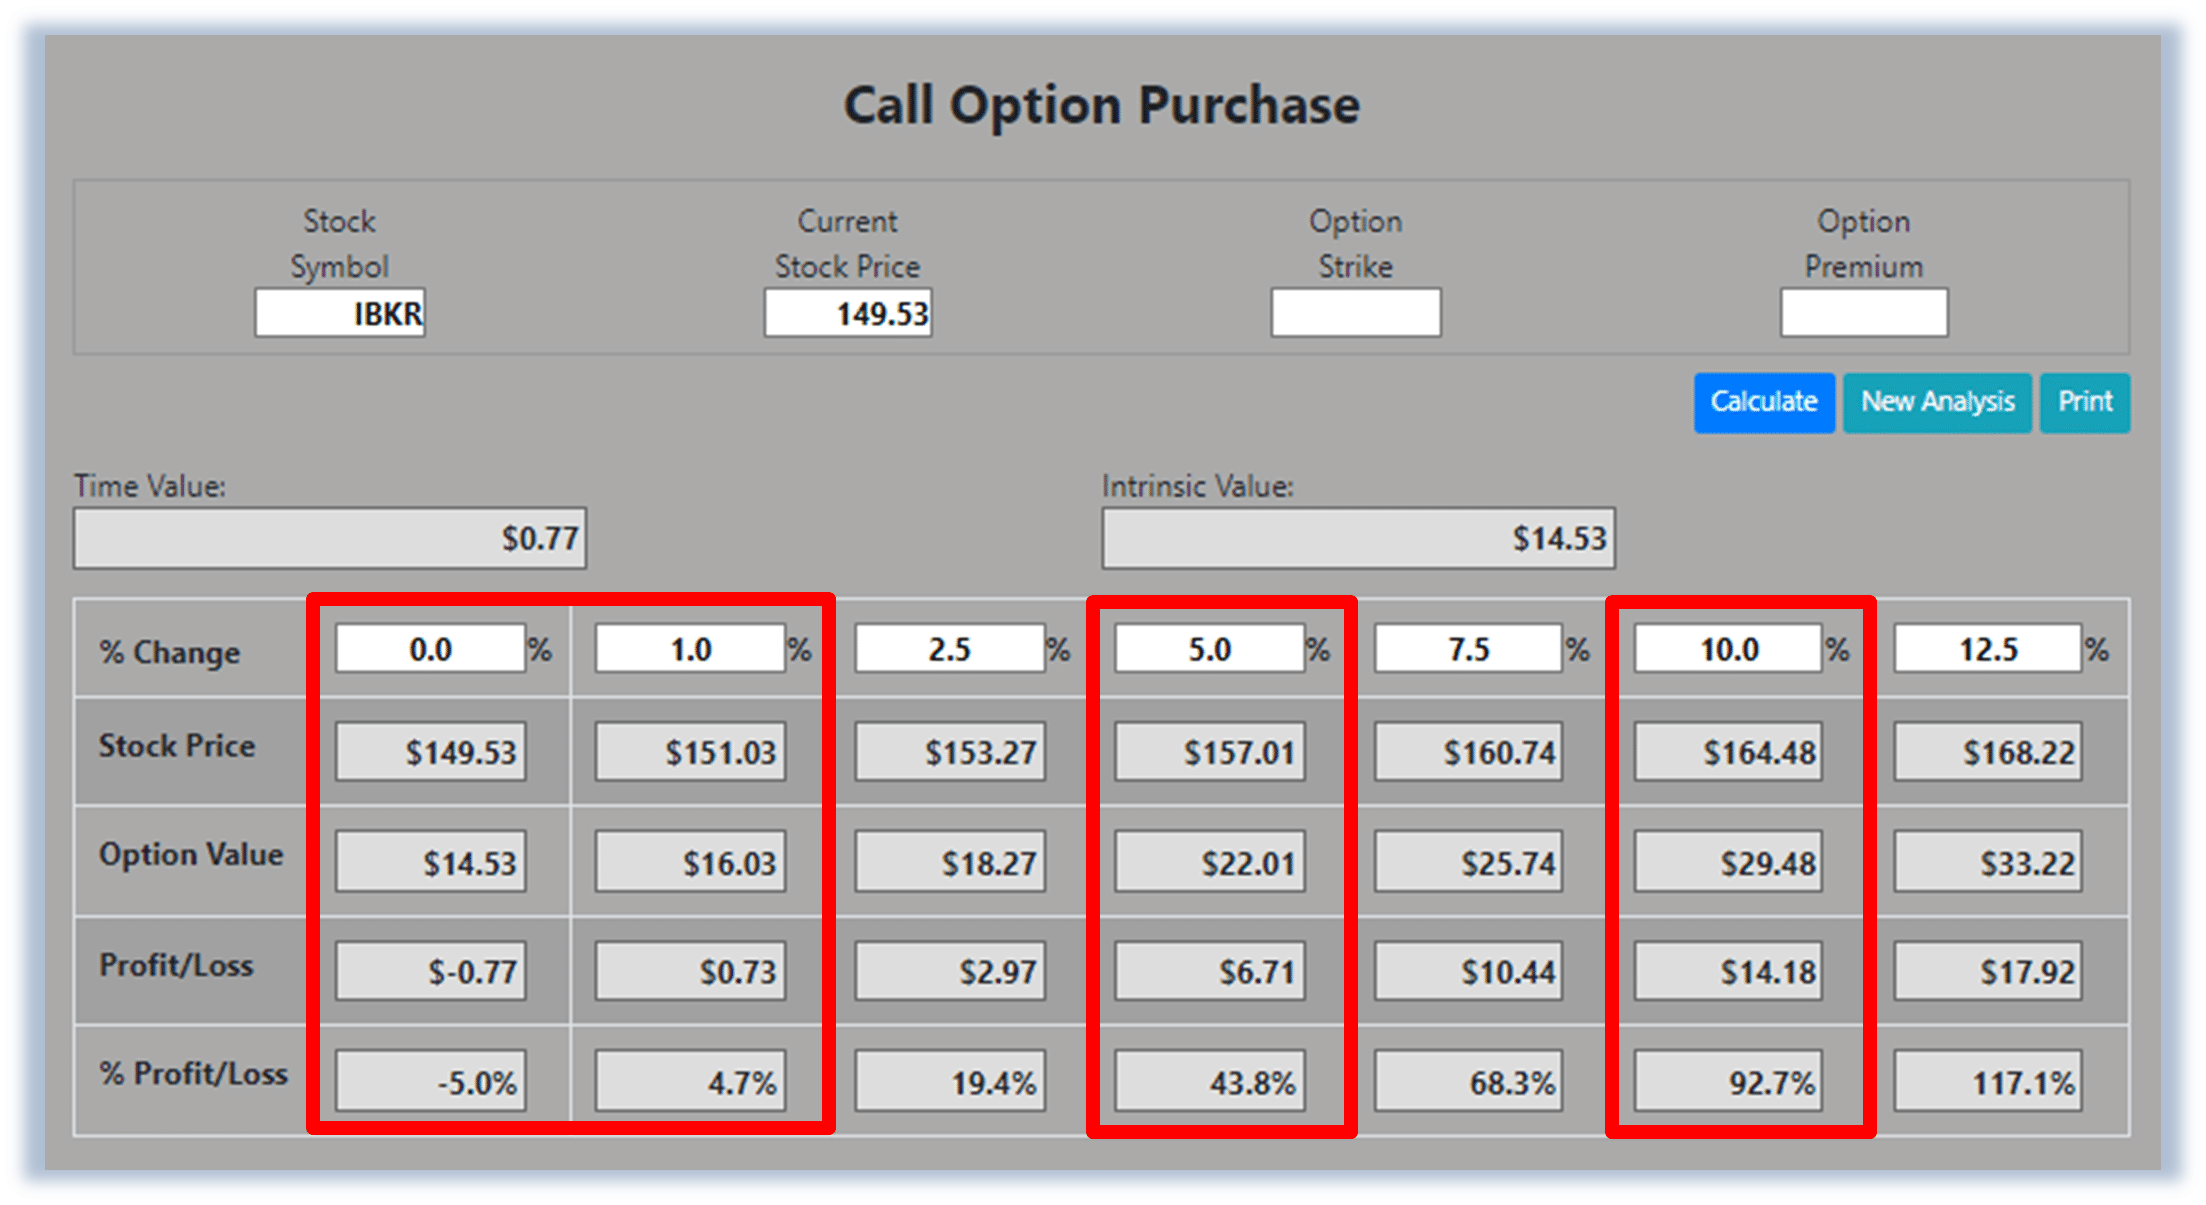
The Call Option Calculator will calculate the profit/loss potential for a call option trade based on the price change of the underlying stock/ETF at option expiration in this example from a flat IBKR price to a 12.5% increase.
The Optioneering Team uses the 1% Rule to select an option strike price with a higher percentage of winning trades. In the following IBKR option example, we used the 1% Rule to select the IBKR option strike price but out of fairness to our paid option service subscribers we don’t list the strike price used in the profit/loss calculation.
Trade with Higher Accuracy
When you use the 1% Rule to select an IBKR in-the-money option strike price, IBKR stock only has to increase 1% for the option to breakeven and start profiting! Remember, if you purchase an at-the-money or out-of-the-money call option and the underlying stock closes flat at option expiration it will result in a 100% loss for your option trade! In this example, if IBKR stock is flat at 149.53 at option expiration, it will only result in a 5.0% loss for the IBKR option compared to a 100% loss for an at-the-money or out-of-the-money call option.
Using the 1% Rule to select an option strike price can result in a higher percentage of winning trades compared to at-the-money or out-of-the-money call options. This higher accuracy can give you the discipline needed to become a successful option trader and can help avoid 100% losses when trading options.
The goal of this example is to demonstrate the powerful profit potential available from trading options compared to stocks.
The prices and returns represented below were calculated based on the current stock and option pricing for IBKR on 10/10/2024 before commissions.
When you purchase a call option, there is no limit on the profit potential of the call if the underlying stock continues to move up in price.
For this specific call option, the calculator analysis below reveals if IBKR stock increases 5.0% at option expiration to 157.01 (circled), the call option would make 43.8% before commission.
If IBKR stock increases 10.0% at option expiration to 164.48 (circled), the call option would make 92.7% before commission and outperform the stock return more than 9 to 1*.
The leverage provided by call options allows you to maximize potential returns on bullish stocks.
The Hughes Optioneering Team is here to help you identify profit opportunities just like this one.
*Trading incurs risk and some people lose money trading