
LULU SHARES SPRINGING HIGHER
Posted by Chuck Hughes | Dec 26, 2023 | Chuck’s Trade of the Day
On Friday, we looked at a Daily Price Chart of Take-Two Interactive Software, Inc., noting that TTWO’s 50-Day EMA is trading above the 100-Day EMA.
For today’s Trade of the Day we will be looking at a Daily Price chart for Lululemon Athletica Inc. stock symbol: LULU.
Before breaking down LULU’s daily price chart let’s first review which products and services are offered by the company.
Lululemon Athletica Inc., together with its subsidiaries, designs, distributes, and retails athletic apparel, footwear, and accessories under the lululemon brand for women and men. It operates in two segments, Company-Operated Stores and Direct to Consumer. The company offers pants, shorts, tops, and jackets for healthy lifestyle, such as yoga, running, training, and other activities.
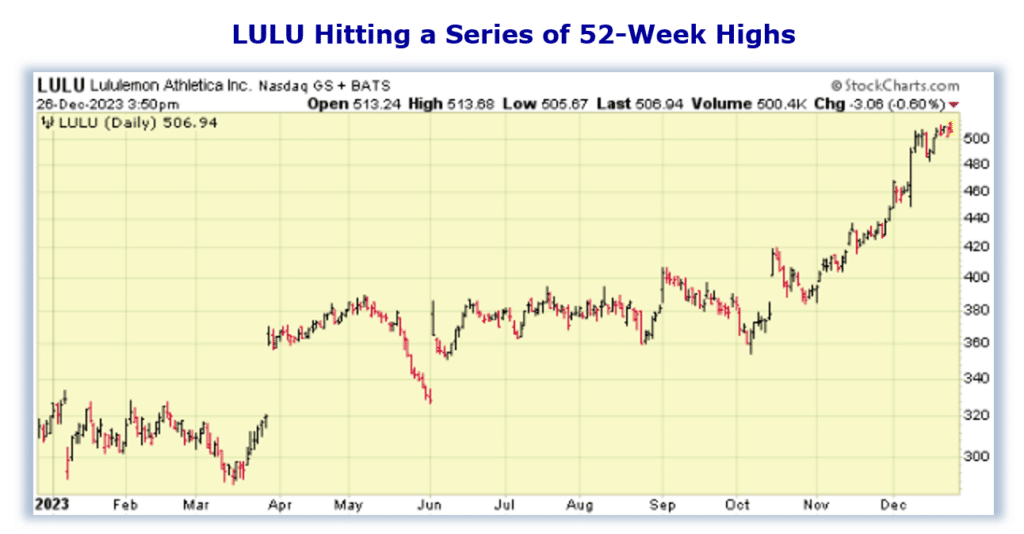
Now, let’s begin to break down the Daily Price chart for LULU. Below is a Daily Price Chart with the price line displayed by an OHLC bar.
Buy LULU Stock
The Daily Price chart above shows that LULU stock has been hitting new 52-Week Highs regularly over the past few weeks.
Simply put, a stock does not just continually hit a series of new 52-Week Highs unless it is in a very strong bullish trend.
The Hughes Optioneering team looks for stocks that are making a series of 52-Week Highs as this is a good indicator that the stock is in a powerful uptrend.
You see, after a stock makes a series of two or more 52-Week Highs, the stock typically continues its price uptrend and should be purchased.
Our initial price target for LULU stock is 515.00 per share.
Profit if LULU is Up, Down or Flat
Now, since LULU is currently making a series of new 52-Week Highs and will likely rally from here, let’s use the Hughes Optioneering calculator to look at the potential returns for a LULU call option spread.
The Call Option Spread Calculator will calculate the profit/loss potential for a call option spread based on the price change of the underlying stock/ETF at option expiration in this example from a 7.5% increase to a 7.5% decrease in LULU stock at option expiration.
The goal of this example is to demonstrate the ‘built in’ profit potential for option spreads and the ability of spreads to profit if the underlying stock is up, down or flat at option expiration. Out of fairness to our paid option service subscribers we don’t list the option strike prices used in the profit/loss calculation.
The prices and returns represented below were calculated based on the current stock and option pricing for LULU on 12/26/2023 before commissions.
Built in Profit Potential
For this option spread, the calculator analysis below reveals the cost of the spread is $657 (circled). The maximum risk for an option spread is the cost of the spread.
The analysis reveals that if LULU stock is flat or up at all at expiration the spread will realize a 52.2% return (circled).
And if LULU stock decreases 7.5% at option expiration, the option spread would make a 33.8% return (circled).
Due to option pricing characteristics, this option spread has a ‘built in’ 52.2% profit potential when the trade was identified*.
Option spread trades can result in a higher percentage of winning trades compared to a directional option trade if you can profit when the underlying stock/ETF is up, down or flat.
A higher percentage of winning trades can give you the discipline needed to become a successful trader.
The Hughes Optioneering Team is here to help you identify profit opportunities just like this one.

Interested in accessing the Optioneering Calculators? Join one of Chuck’s Trading Services for unlimited access! The Optioneering Team has option calculators for six different option strategies that allow you to calculate the profit potential for an option trade before you take the trade.
*Trading incurs risk and some people lose money trading.