
ROSS STORES IN THE ‘BUY ZONE’
POSTED BY CHUCK HUGHES | JAN 11, 2024 | CHUCK’S TRADE OF THE DAY
On Jan 10th, we looked at a Monthly Price Chart of Progressive Corp., noting that PGR’s 1-Month Price is trading above the 10-Month SMA signaling a ‘Buy’.
For today’s Trade of the Day we will be looking at a Keltner Channel chart for Ross Stores, Inc. stock symbol: ROST.
Before breaking down ROST’s daily Keltner Channel chart let’s first review which products and services are offered by the company.
Ross Stores, Inc., together with its subsidiaries, operates off-price retail apparel and home fashion stores under the Ross Dress for Less and dd’s DISCOUNTS brand names in the United States. Its stores primarily offer apparel, accessories, footwear, and home fashions.
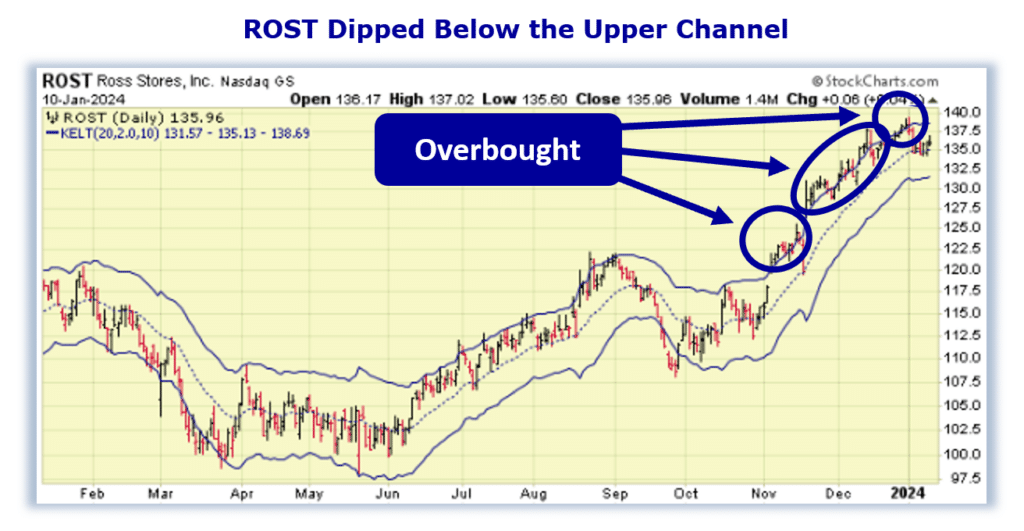
Now, let’s begin to break down the Keltner Channel chart for ROST. Below is a Daily Price Chart and the three Keltner Channels for ROST stock.
Buy ROST Stock
The Hughes Optioneering Team uses the Keltner Channels as an indicator to determine whether a stock is overbought or oversold. If a stock’s daily stock price is trading above the upper Keltner Channel, this signals that the stock is temporarily overbought and subject to a retracement.
Even stocks that are in the strongest bull trends do not advance in a straight line. There are always price retracements along the way. When a stock becomes overbought, its price will typically decline soon after as the inevitable profit taking occurs.
The ROST daily price chart shows that the stock is in a strong price uptrend and has become overbought several times. You can see this as ROST has traded above the Upper Keltner Channel on multiple occasions recently.
But, in every scenario when ROST became overbought, the stock soon experienced a pullback.
Finding opportunities when a stock experiences a pullback is why the Hughes Optioneering Team uses the Keltner Channels. They help us find a lower-risk entry point.
The Keltner Channel “Buy Zone” occurs when a stock is trading below the upper Keltner Channel. Once the daily price is trading below the upper channel, it provides a lower risk buying opportunity as the stock is likely to rally.
Our initial price target for ROST stock is 142.00 per share.
110.8% Profit Potential for ROST Option
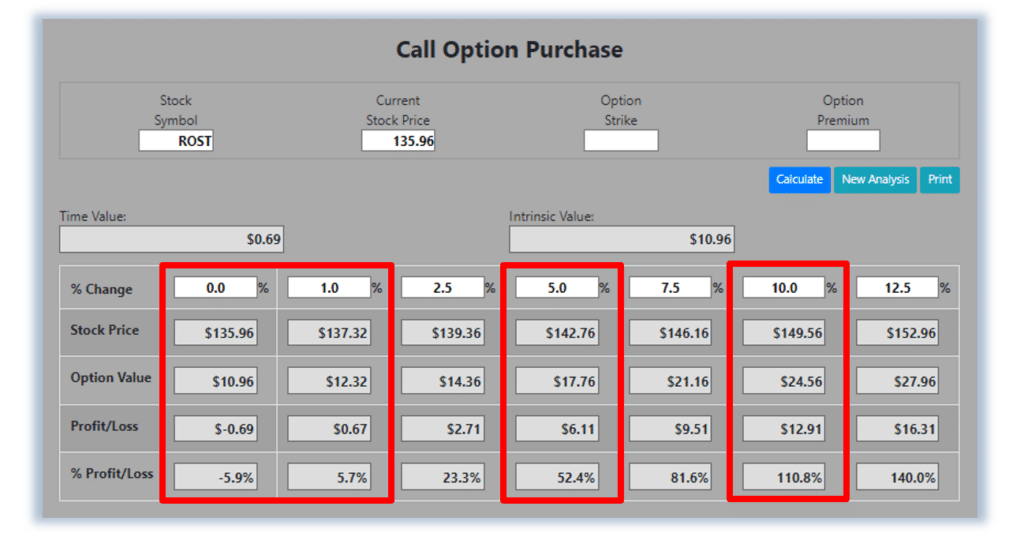
Now, since ROST stock is trading in the Keltner Channel ‘Buy Zone’ this offers a prime trade entry opportunity. Let’s use the Hughes Optioneering calculator to look at the potential returns for a ROST call option purchase.
The Call Option Calculator will calculate the profit/loss potential for a call option trade based on the price change of the underlying stock/ETF at option expiration in this example from a flat ROST price to a 12.5% increase.
The Optioneering Team uses the 1% Rule to select an option strike price with a higher percentage of winning trades. In the following ROST option example, we used the 1% Rule to select the ROST option strike price but out of fairness to our paid option service subscribers we don’t list the strike price used in the profit/loss calculation.
Trade with Higher Accuracy
When you use the 1% Rule to select a ROST in-the-money option strike price, ROST stock only has to increase 1% for the option to breakeven and start profiting! Remember, if you purchase an at-the-money or out-of-the-money call option and the underlying stock closes flat at option expiration it will result in a 100% loss for your option trade! In this example, if ROST stock is flat at 135.96 at option expiration, it will only result in a 5.9% loss for the ROST option compared to a 100% loss for an at-the-money or out-of-the-money call option.
Using the 1% Rule to select an option strike price can result in a higher percentage of winning trades compared to at-the-money or out-of-the-money call options. This higher accuracy can give you the discipline needed to become a successful option trader and can help avoid 100% losses when trading options.
The goal of this example is to demonstrate the powerful profit potential available from trading options compared to stocks.
The prices and returns represented below were calculated based on the current stock and option pricing for ROST on 1/10/2024 before commissions.
When you purchase a call option, there is no limit on the profit potential of the call if the underlying stock continues to move up in price.
For this specific call option, the calculator analysis below reveals if ROST stock increases 5.0% at option expiration to 142.76 (circled), the call option would make 52.4% before commission.
If ROST stock increases 10.0% at option expiration to 149.56 (circled), the call option would make 110.8% before commission and outperform the stock return more than 11 to 1*.
The leverage provided by call options allows you to maximize potential returns on bullish stocks.
The Hughes Optioneering Team is here to help you identify profit opportunities just like this one.
Interested in accessing the Optioneering Calculators? Join one of Chuck’s Trading Services for unlimited access! The Optioneering Team has option calculators for six different option strategies that allow you to calculate the profit potential for an option trade before you take the trade.