
Time to Consider Tractor Supply Co.?
May 30th, 2024
Time to Consider Tractor Supply Co.?
On May 29th we looked at a Monthly Price Chart of RadNet, Inc., noting that RDNT’s 1-Month Price is trading above the 10-Month SMA signaling a ‘Buy’.
Yesterday we looked at Trade of the Day we will be looking at an On Balance Volume chart for Tractor Supply Co. stock symbol: TSCO.
Before breaking down TSCO’s OBV chart let’s first review which products and services are offered by the company.
Tractor Supply Company is the largest operator of rural lifestyle retail stores in America. Tractor Supply stores are focused on supplying the lifestyle needs of recreational farmers & ranchers & others who enjoy the rural lifestyle, as well as tradesmen and small businesses.
Confirming a Price Uptrend with OBV
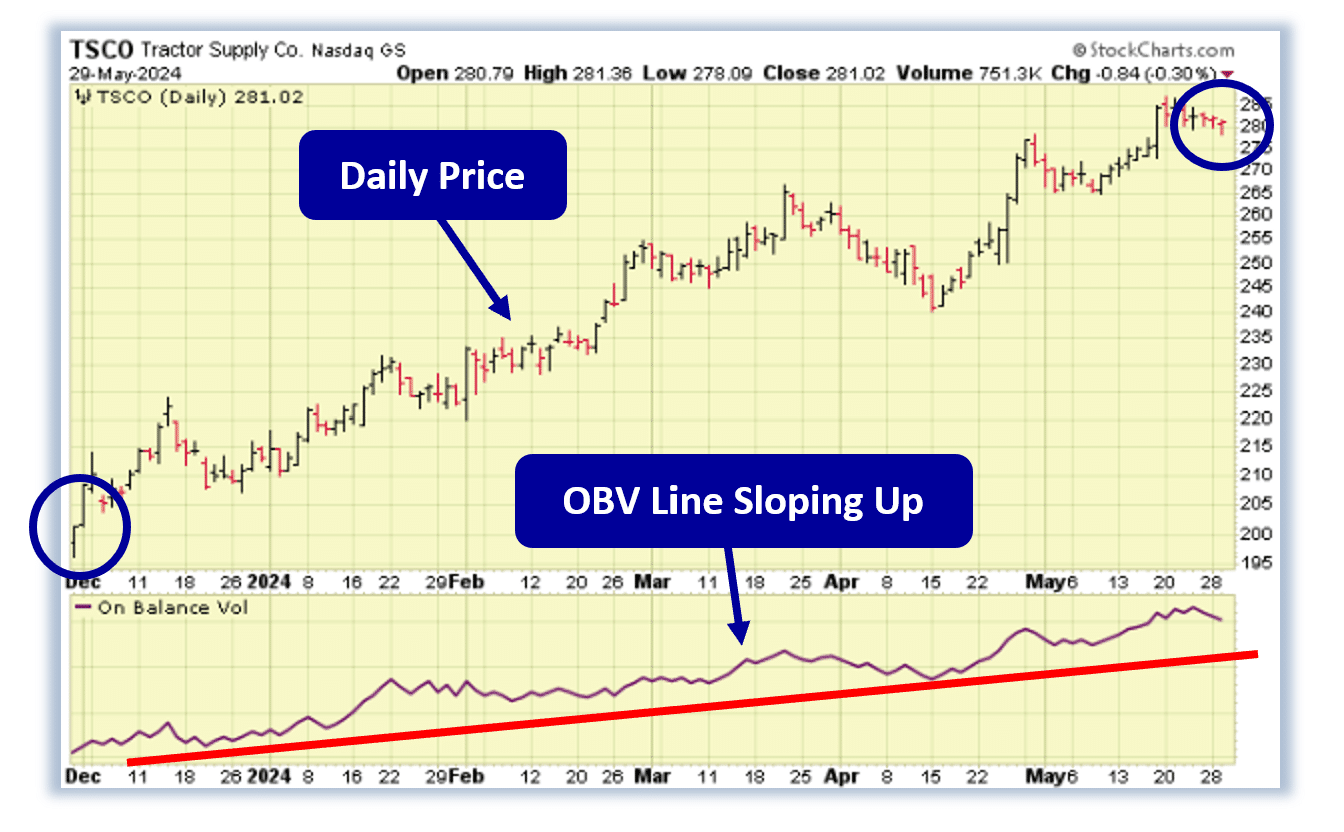
The TSCO daily price chart below shows that TSCO is in a price uptrend as the current price is above the price TSCO traded at six months ago (circled). The On Balance Volume chart is below the daily chart.
On Balance Volume measures volume flow with a single Easy-to-Read Line. Volume flow precedes price movement and helps sustain the price uptrend. When a stock closes up, volume is added to the line. When a stock closes down, volume is subtracted from the line. A cumulative total of these additions and subtractions form the OBV line.
On Balance Volume Indicator
● When Close is Up, Volume is Added
● When Close is Down, Volume is Subtracted
● A Cumulative Total of Additions and Subtractions form the OBV Line
Volume flow precedes price and is the key to measuring the validity and sustainability of a price trend.
We can see from the OBV chart below that the On Balance Volume line for TSCO is sloping up. An up-sloping line indicates that the volume is heavier on up days and buying pressure is exceeding selling pressure. Buying pressure must continue to exceed selling pressure in order to sustain a price uptrend. So, On Balance Volume is a simple indicator to use that confirms the price uptrend and its sustainability.
The numerical value of the On Balance Volume line is not important. We simply want to see an up-sloping line to confirm a price uptrend.
Confirmed ‘Buy’ Signal for TSCO
Since TSCO’s OBV line is sloping up, the most likely future price movement for TSCO is up, making TSCO a good candidate for a stock purchase or a call option spread.
Let’s use the Hughes Optioneering calculator to look at the potential returns for a TSCO debit spread.
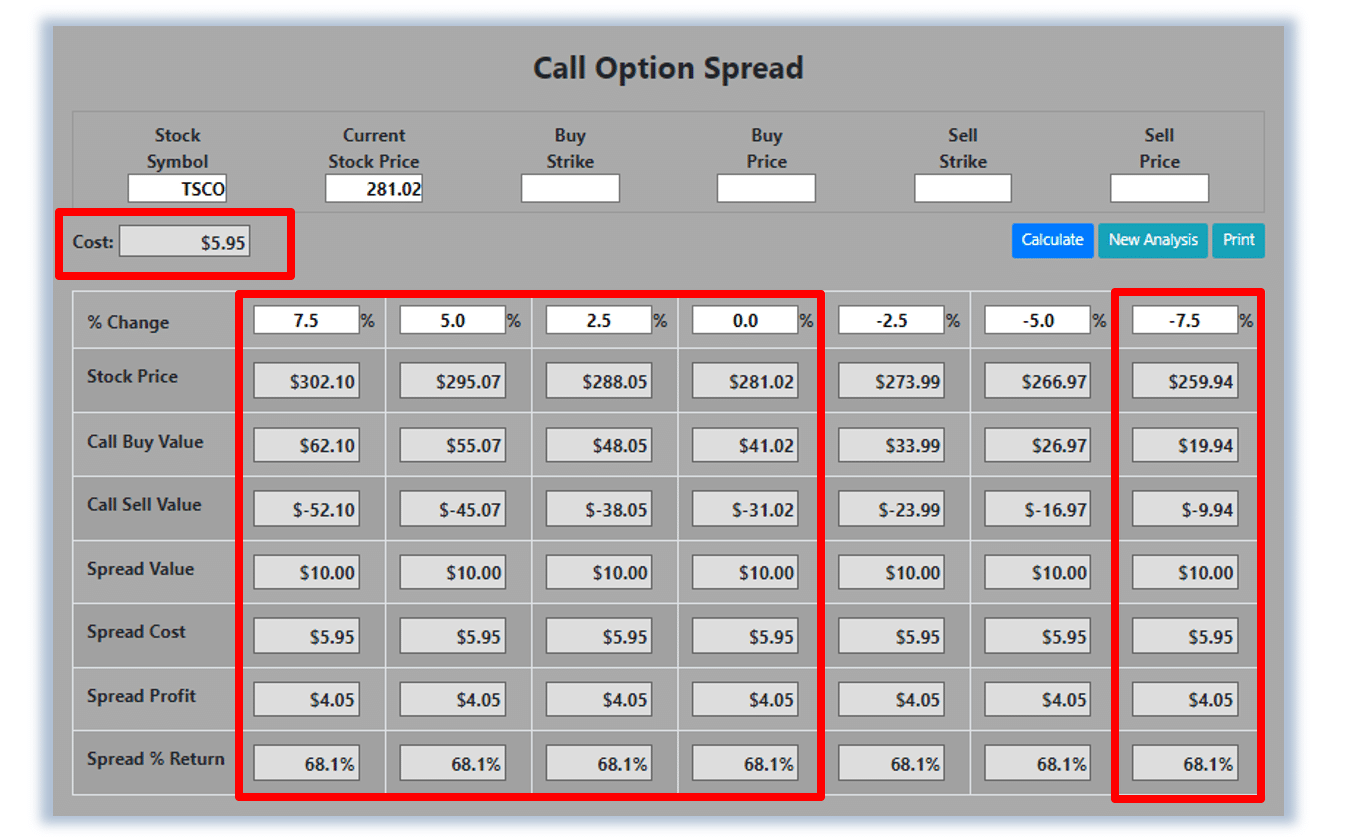
The Call Option Spread Calculator will calculate the profit/loss potential for a call option spread based on the price change of the underlying stock/ETF at option expiration in this example from a 7.5% increase to a 7.5% decrease in TSCO stock at option expiration.
The goal of this example is to demonstrate the ‘built in’ profit potential for option spreads and the ability of spreads to profit if the underlying stock is up, down or flat at option expiration. Out of fairness to our paid option service subscribers we don’t list the option strike prices used in the profit/loss calculation.
The prices and returns represented below were calculated based on the current stock and option pricing for TSCO on 5/29/2024 before commissions.
Built in Profit Potential
For this option spread, the calculator analysis below reveals the cost of the spread is $595 (circled). The maximum risk for an option spread is the cost of the spread.
The analysis reveals that if TSCO stock is flat or up at all at expiration the spread will realize a 68.1% return (circled).
And if TSCO stock decreases 7.5% at option expiration, the option spread would make a 68.1% return (circled).
Due to option pricing characteristics, this option spread has a ‘built in’ 68.1% profit potential when the trade was identified*.
Option spread trades can result in a higher percentage of winning trades compared to a directional option trade if you can profit when the underlying stock/ETF is up, down or flat.
A higher percentage of winning trades can give you the discipline needed to become a successful trader.
The Hughes Optioneering Team is here to help you identify profit opportunities just like this one.
Interested in accessing the Optioneering Calculators? Join one of Chuck’s Trading Services for unlimited access! The Optioneering Team has option calculators for six different option strategies that allow you to calculate the profit potential for an option trade before you take the trade.

Chuck Hughes
*Trading incurs risk and some people lose money trading.