
Power Up Your Portfolio with NextEra?
June 6th, 2024
On June 5th, we looked at a Monthly Price Chart of Intuitive Surgical, Inc., noting that ISRG’s 1-Month Price is trading above the 10-Month SMA signaling a ‘Buy’.
For June 6th Trade of the Day we will be looking at a Keltner Channel chart for NextEra Energy Inc. stock symbol: NEE.
Before breaking down NEE’s daily Keltner Channel chart let’s first review which products and services are offered by the company.
NextEra Energy Inc. is a public utility holding company engaged in the generation, transmission, distribution, and sale of electric energy. The company has both regulated and non-regulated energy-related products and services, with operations in the U.S. and Canada. NextEra Energy’s primary subsidiaries are Florida Power & Light Company, Gulf Power Company and NextEra Energy Resources LLC.
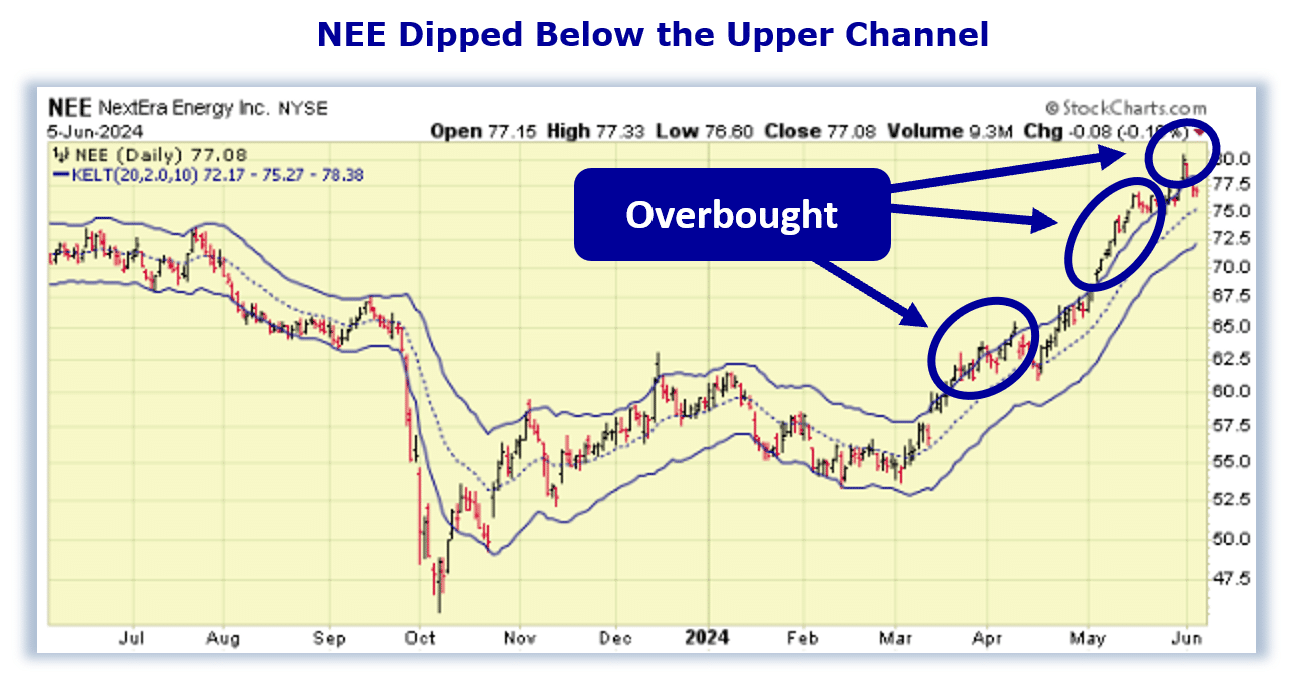
Now, let’s begin to break down the Keltner Channel chart for NEE. Below is a Daily Price Chart and the three Keltner Channels for NEE stock.
Buy NEE Stock
The Hughes Optioneering Team uses the Keltner Channels as an indicator to determine whether a stock is overbought or oversold. If a stock’s daily stock price is trading above the upper Keltner Channel, this signals that the stock is temporarily overbought and subject to a retracement.
Even stocks that are in the strongest bull trends do not advance in a straight line. There are always price retracements along the way. When a stock becomes overbought, it’s price will typically decline soon after as the inevitable profit taking occurs.
The NEE daily price chart shows that the stock is in a strong price uptrend and has become overbought several times. You can see this as NEE has traded above the Upper Keltner Channel on multiple occasions recently.
But, in every scenario when NEE became overbought, the stock soon experienced a pullback.
Finding opportunities when a stock experiences a pullback is why the Hughes Optioneering Team uses the Keltner Channels. They help us find a lower-risk entry point.
The Keltner Channel “Buy Zone” occurs when a stock is trading below the upper Keltner Channel. Once the daily price is trading below the upper channel, it provides a lower-risk buying opportunity as the stock is likely to rally.
Our initial price target for NEE stock is 80.15 per share.
106.0% Profit Potential for NEE Option
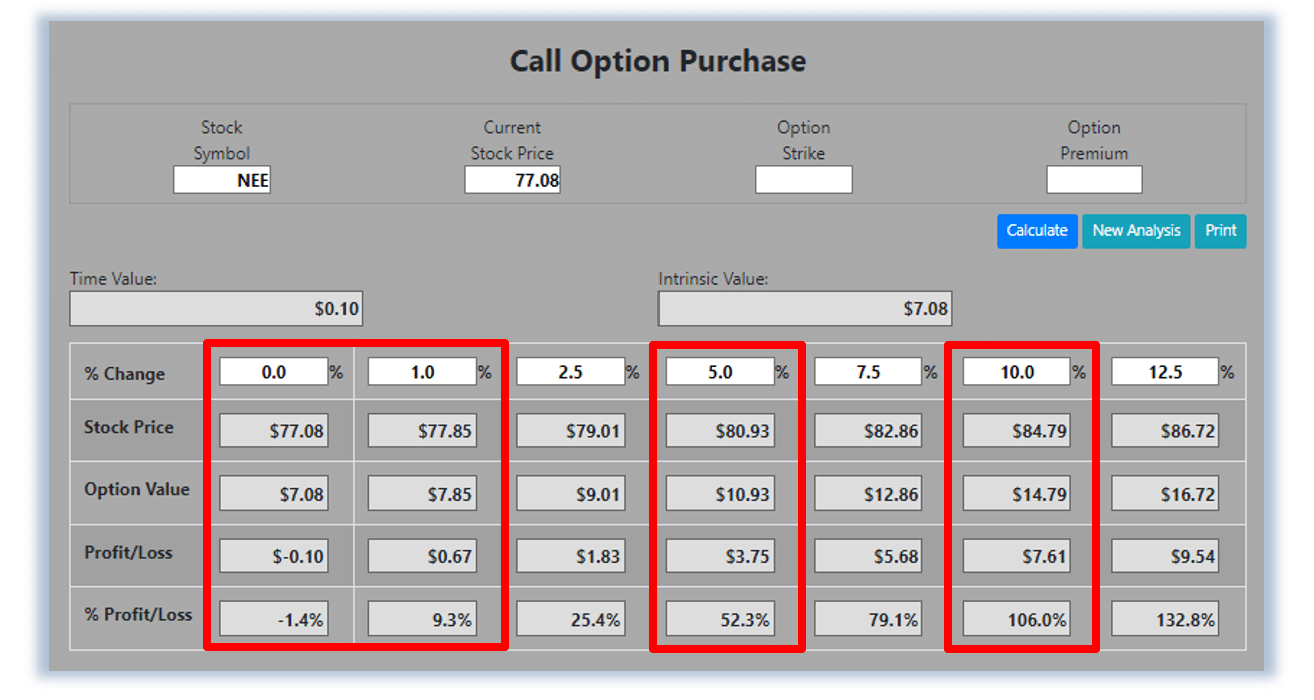
Now, since NEE stock is currently trading below the upper Keltner Channel this offers a prime trade entry opportunity. Let’s use the Hughes Optioneering calculator to look at the potential returns for a NEE call option purchase.
The Call Option Calculator will calculate the profit/loss potential for a call option trade based on the price change of the underlying stock/ETF at option expiration in this example from a flat NEE price to a 12.5% increase.
The Optioneering Team uses the 1% Rule to select an option strike price with a higher percentage of winning trades. In the following NEE option example, we used the 1% Rule to select the NEE option strike price but out of fairness to our paid option service subscribers we don’t list the strike price used in the profit/loss calculation.
Trade with Higher Accuracy
When you use the 1% Rule to select a NEE in-the-money option strike price, NEE stock only has to increase 1% for the option to breakeven and start profiting! Remember, if you purchase an at-the-money or out-of-the-money call option and the underlying stock closes flat at option expiration it will result in a 100% loss for your option trade! In this example, if NEE stock is flat at 77.08 at option expiration, it will only result in a 1.4% loss for the NEE option compared to a 100% loss for an at-the-money or out-of-the-money call option.
Using the 1% Rule to select an option strike price can result in a higher percentage of winning trades compared to at-the-money or out-of-the-money call options. This higher accuracy can give you the discipline needed to become a successful option trader and can help avoid 100% losses when trading options.
The goal of this example is to demonstrate the powerful profit potential available from trading options compared to stocks.
The prices and returns represented below were calculated based on the current stock and option pricing for NEE on 6/5/2024 before commissions.
When you purchase a call option, there is no limit on the profit potential of the call if the underlying stock continues to move up in price.
For this specific call option, the calculator analysis below reveals if NEE stock increases 5.0% at option expiration to 80.93 (circled), the call option would make 52.3% before commission.
If NEE stock increases 10.0% at option expiration to 84.79 (circled), the call option would make 106.0% before commission and outperform the stock return more than 10 to 1*.
The leverage provided by call options allows you to maximize potential returns on bullish stocks.
The Hughes Optioneering Team is here to help you identify profit opportunities just like this one.
Interested in accessing the Optioneering Calculators? Join one of Chuck’s Trading Services for unlimited access! The Optioneering Team has option calculators for six different option strategies that allow you to calculate the profit potential for an option trade before you take the trade.
Check out Chuck’s PRO Trading Service!

Chuck Hughes
*Trading incurs risk and some people lose money trading.