
TJX Stands Out Among Retail Sector
June 4th, 2024
TJX Stands Out Among Retail Sector
On June 3rd we looked at a Daily Price Chart of Ares Capital Corp., noting that ARCC’s 24/52 Day MACD is trading above the 18-Day EMA signaling a ‘Buy’.
June 4th Trade of the Day we will be looking at a Daily Price chart for The TJX Companies, Inc. stock symbol: TJX.
Before breaking down TJX’s daily price chart let’s first review which products and services are offered by the company.
The TJX Companies, Inc. is a leading off-price retailer of apparel and home fashions in the U.S. and worldwide. The company’s broad range of assortments at varying prices helps it to reach out to a broad range of consumers.
Now, let’s begin to break down the Daily Price chart for TJX. Below is a Daily Price Chart with the price line displayed by an OHLC bar.

Buy TJX Stock
The Daily Price chart above shows that TJX stock has been hitting new 52-Week Highs regularly over the past week.
Simply put, a stock does not just continually hit a series of new 52-Week Highs unless it is in a very strong bullish trend.
The Hughes Optioneering team looks for stocks that are making a series of 52-Week Highs as this is a good indicator that the stock is in a powerful uptrend.
You see, after a stock makes a series of two or more 52-Week Highs, the stock typically continues its price uptrend and should be purchased.
Our initial price target for TJX stock is 109.20 per share.
Profit if TJX is Up, Down, or Flat
Now, since TJX is currently making a series of new 52-Week Highs and will likely rally from here, let’s use the Hughes Optioneering calculator to look at the potential returns for a TJX call option spread.
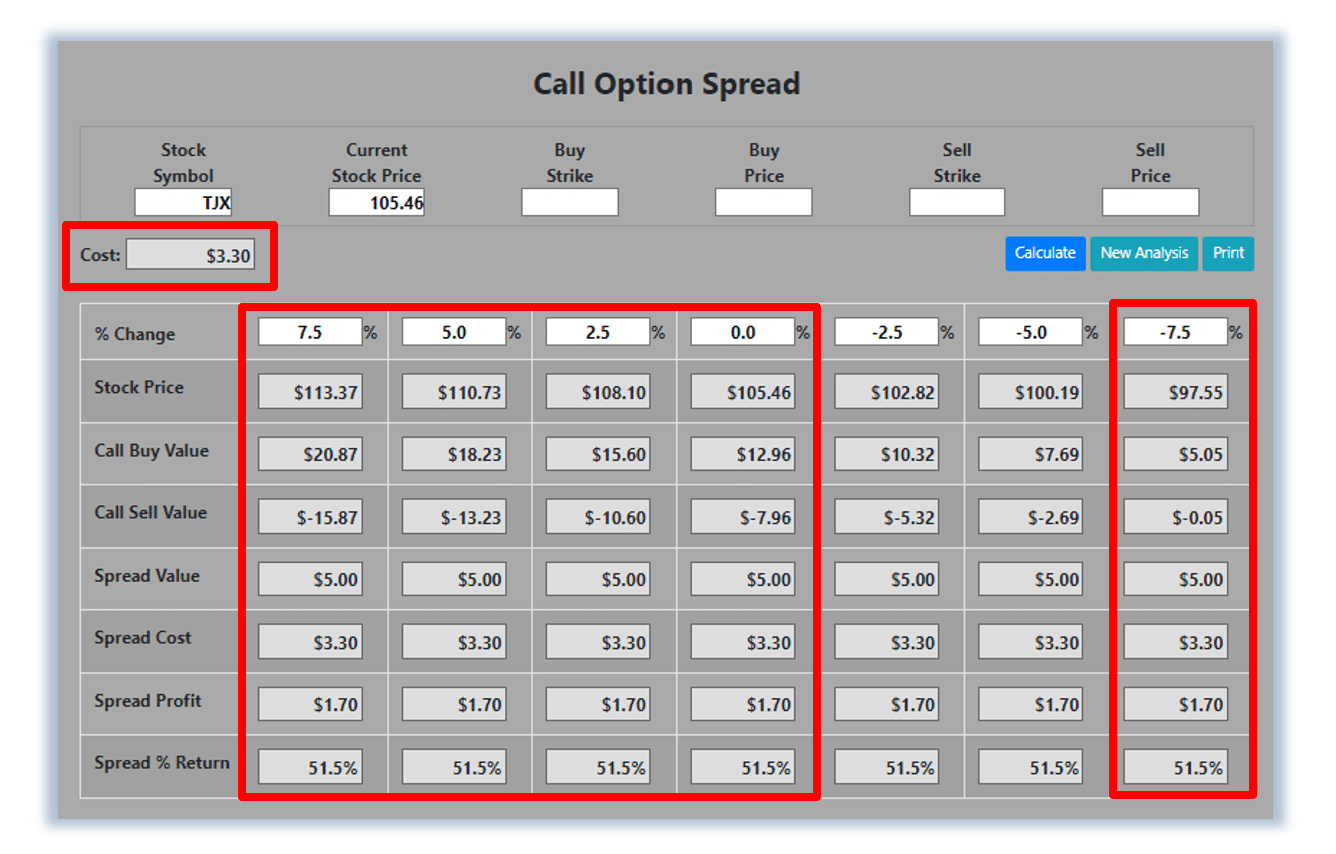
The Call Option Spread Calculator will calculate the profit/loss potential for a call option spread based on the price change of the underlying stock/ETF at option expiration in this example from a 7.5% increase to a 7.5% decrease in TJX stock at option expiration.
The goal of this example is to demonstrate the ‘built in’ profit potential for option spreads and the ability of spreads to profit if the underlying stock is up, down or flat at option expiration. Out of fairness to our paid option service subscribers we don’t list the option strike prices used in the profit/loss calculation.
The prices and returns represented below were calculated based on the current stock and option pricing for TJX on 6/3/2024 before commissions.
Built in Profit Potential
For this option spread, the calculator analysis below reveals the cost of the spread is $330 (circled). The maximum risk for an option spread is the cost of the spread.
The analysis reveals that if TJX is flat or up at all at expiration the spread will realize a 51.5% return (circled).
And if TJX decreases 7.5% at option expiration, the option spread would make a 51.5% return (circled).
Due to option pricing characteristics, this option spread has a ‘built in’ 51.5% profit potential when the trade was identified*.
Option spread trades can result in a higher percentage of winning trades compared to a directional option trade if you can profit when the underlying stock/ETF is up, down or flat.
A higher percentage of winning trades can give you the discipline needed to become a successful trader.
The Hughes Optioneering Team is here to help you identify profit opportunities just like this one.
Interested in accessing the Optioneering Calculators? Join one of Chuck’s Trading Services for unlimited access! The Optioneering Team has option calculators for six different option strategies that allow you to calculate the profit potential for an option trade before you take the trade.

Chuck Hughes
*Trading incurs risk and some people lose money trading.